

The following table gives the vapor pressure of water for various temperatures a. Plot a scatter diagram.
Question:
The following table gives the vapor pressure of water for various temperatures
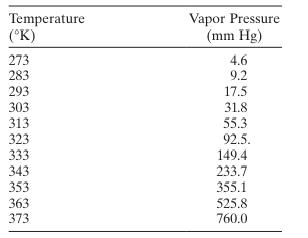
a. Plot a scatter diagram. Does it seem likely that a straight-line model will be adequate?
b. Fit the straight-line model. Compute the summary statistics and the residual plots. What are your conclusions regarding model adequacy?
c. From physical chemistry the Clausius-Clapeyron equation states that
\[
\ln \left(p_{v}\right) \propto-\frac{1}{T}
\]
Repeat part \(\mathrm{b}\) using the appropriate transformation based on this information.
b. Fit the straight-line model. Compute the summary statistics and the residual plots. What are your conclusions regarding model adequacy?
Step by Step Answer:

This question has not been answered yet.
You can Ask your question!


Introduction To Linear Regression Analysis
ISBN: 9781119578727
6th Edition
Authors: Douglas C. Montgomery, Elizabeth A. Peck, G. Geoffrey Vining
