In Fig. 17-8, the sawtooth wave of Example 17.1 and its line spectrum are shown. Since there
Question:
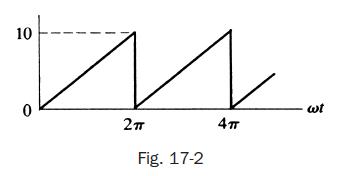
In Fig. 17-8, the sawtooth wave of Example 17.1 and its line spectrum are shown. Since there were only sine terms in the trigonometric series, the harmonic amplitudes are given directly by 1/2 a0 and |bn|. The same line spectrum is obtained from the exponential Fourier series, (13).

Data from Example 17.1
Find the Fourier series for the waveform shown in Fig. 17-2.

Fantastic news! We've Found the answer you've been seeking!
Step by Step Answer:
Related Book For 

Schaum S Outline Of Electric Circuits
ISBN: 9781260011968
7th Edition
Authors: Mahmood Nahvi, Joseph Edminister
Question Posted:


