

Question: Carry out a sensitivity analysis on a model (e.g. the bank model, the Wardeon Cinema model or the Panorama Televisions model). Select two or three
Carry out a sensitivity analysis on a model (e.g. the bank model, the Wardeon Cinema model or the Panorama Televisions model). Select two or three key data and vary them to determine the sensitivity of
the results. Vary the data individually and in combination in order to understand their effect on the simulation results.
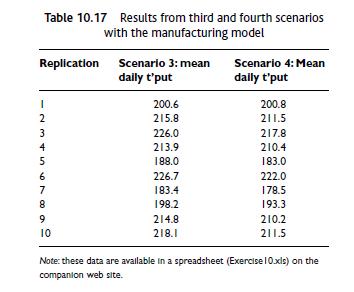
Table 10.17 Results from third and fourth scenarios with the manufacturing model Replication Scenario 3: mean Scenario 4: Mean daily t'put daily t'put 200.6 200.8 2345 215.8 211.5 226.0 217.8 213.9 210.4 188.0 183.0 6 226.7 222.0 7 183.4 178.5 8 198.2 193.3 9 214.8 210.2 10 218.1 211.5 Note: these data are available in a spreadsheet (Exercise 10.xls) on the companion web site.
Step by Step Solution
There are 3 Steps involved in it

Get step-by-step solutions from verified subject matter experts