Question: In the student sample program files for this chapter, you will find a text file named GasPrices.txt. The file contains the weekly average prices for
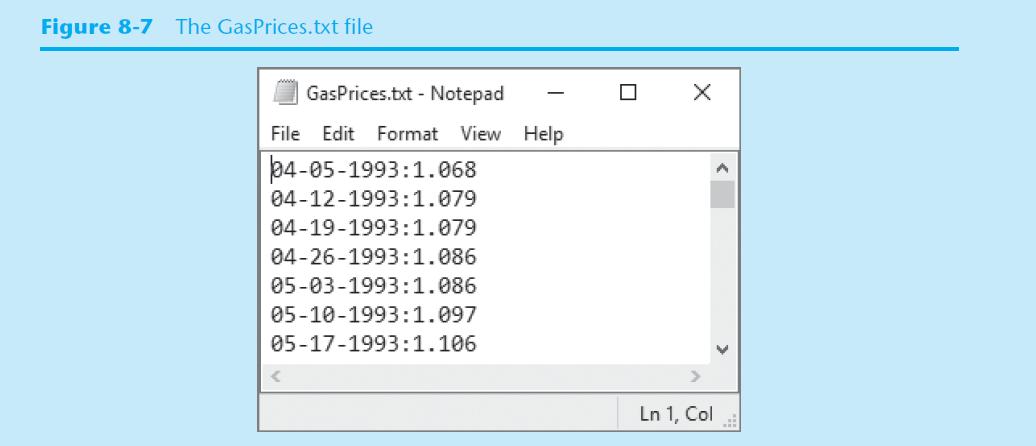
In the student sample program files for this chapter, you will find a text file named GasPrices.txt. The file contains the weekly average prices for a gallon of gas in the United States, beginning on April 5th, 1993, and ending on August 26th, 2013. Figure 8-7 shows an example of the first few lines of the file’s contents:
Each line in the file contains the average price for a gallon of gas on a specific date. Each line is formatted in the following way:
MM-DD-YYYY:Price
MM is the two-digit month, DD is the two-digit day, and YYYY is the four-digit year. Price is the average price per gallon of gas on the specified date.
For this assignment, you are to write one or more programs that read the contents of the file and perform the following calculations:
Average Price Per Year: Calculate the average price of gas per year, for each year in the file. (The file’s data starts in April of 1993, and it ends in August 2013. Use the data that is present for the years 1993 and 2013.)
Average Price Per Month: Calculate the average price for each month in the file.
Highest and Lowest Prices Per Year: For each year in the file, determine the date and amount for the lowest price, and the highest price.
List of Prices, Lowest to Highest: Generate a text file that lists the dates and prices, sorted from the lowest price to the highest.
List of Prices, Highest to lowest: Generate a text file that lists the dates and prices, sorted from the highest price to the lowest.
You can write one program to perform all of these calculations, or you can write different programs, one for each calculation.
Based on the given solution to above problem:
Please create:
1. Flowchart
2. Hierarchy chart
3. Python program
For the following problem
List of Prices, Highest to lowest: Generate a text file that lists the dates and prices, sorted from the highest price to the lowest.
Figure 8-7 The GasPrices.txt file GasPrices.txt - Notepad File Edit Format View Help 04-05-1993:1.068 04-12-1993:1.079 04-19-1993:1.079 04-26-1993:1.086 05-03-1993:1.086 05-10-1993:1.097 05-17-1993:1.106 X Ln 1, Col
Step by Step Solution
3.42 Rating (152 Votes )
There are 3 Steps involved in it
I can help you with the Python program Heres a sample program that reads the GasPricestxt file extra... View full answer

Get step-by-step solutions from verified subject matter experts


