

10. Refer to Problem 9 17 and Table 9 13. Table 14.8 shows a SAS computer printout...
Question:
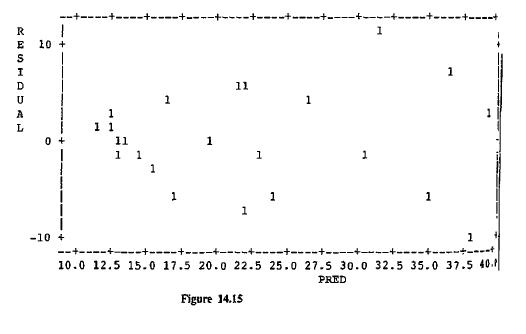
10. Refer to Problem 9 17 and Table 9 13. Table 14.8 shows a SAS computer printout of var- ious diagnostics from filling the muluple regression model relating birth rate to literacy and women's economic activity (deleung Germany. South Africa. and Vietnam). Figure 14 15 plots the residuals against the predicted values
a) Construct a histograin or stem and leaf plot of the residuals Are there any apparent outliers?
b) Study the plot of the residuals in Figure 14.15. Does it suggest any lack of fit or un- usual observations?
c) Study the studentized residuals. Are there any apparent outliers?
d) Study the hat values. Which, if any, observations seem to have noticeable leverage for affecting results?
TABLE 14.8 Hat Diag ECONOMIC LITERACY Obs Residual Rstudent H Dffits Dfbetas Dfbetas 1 -1.3206 -0.2689 0.2142 -0.1404 0.1241 -0.0366 2 -0.1343 -0.0254 0.0892 -0.0079 0.0046 -0.0049 3 0.4247 0.0799 0.0825 0.0240 0.0059 0.0115 4 -1.6682 -0.3109 0.0609 -0.0792 0.0414 -0.0255 5 1.1756 0.2228 0.0939 0.0717 0.0193 0.0362 6 -6.1951 -1.4491 0.3413 -1.0431 -0.8872 0.7387 7 -7.5264 -1.4631 0.0444 -0.3155 -0.0443 0.0300 8 1.0598 0.2065 0.1435 0.0845 0.0591 0.0101 9 -6.3002 -1.3203 0.1932 -0.6460 0.4854 0.0646 10 -0.1617 -0.0305 0.0888 -0.0095 -0.0034 -0.0039 11 -10.3055 -2.3789 0.2095 -1.2246 -0.0669 1.0154 12 11.9146 2.6422 0.0975 0.8686 -0.3750 -0.3203 13 3.8617 0.7327 0.0729 0.2055 -0.0461 0.1302 14 -2.0574 -0.3906 0.0922 -0.1245 -0.0410 -0.0559 15 6.0212 1.1540 0.0545 0.2771 0.1186 -0.0849 16 5.1775 0.9953 0.0759 0.2853 -0.1691 0.1426 17 6.8923. 1.5766 0.2986 1.0287 0.4571 -0.9487 18 2.2296 0.4562 0.2161 0.2395 -0.1083 -0.1220 19 3.7082 0.6968 0.0573 0.1717 0.0065 -0.0789 20 -2.7683 -0.5296 0.1002 -0.1768 -0.1236 0.0073 21 -5.5905 -1.1665 0.2012 -0.5855 0.4080 -0.4618 22 -1.0508 -0.1973 0.0774 -0.0571 -0.0131 -0.0266 23 2.6138 0.4981 0.0947 0.1611 0.0586 0.0688
e) Based on the answers in
(c) and (d), does it seem as if any observations may be partic- ularly influential? Explain.
f) Study the DPFITS values. Identify a few observations that may have a strong influence on the fitted values. g) Study the DFBETAS values Identify an observation that is influential for the literacy estimale but not for the economic activity estimate.
Step by Step Answer:

This question has not been answered yet.
You can Ask your question!


Statistical Methods For The Social Sciences
ISBN: 9780135265260
3rd Edition
Authors: Alan Agresti, Barbara Finlay
