

7 Refer to Table 13 1. Not reported there were observations for ten Asian Americans. Their (X,...
Question:
7 Refer to Table 13 1. Not reported there were observations for ten Asian Americans. Their (X, Y) values follow: Subject Education 16 14 2 3 4 5 12 18 Income 35 21 36 13 12 28 16 19 29 629 7 8 9 10 16 16 14 10 41 18 10
a) Fit the analysis of covariance model using all four groups, assuming no interaction. Interpret the parameter estimates.
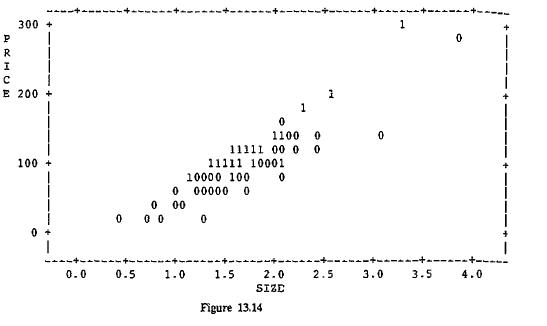 TABLE 13.17 Parameter Standard T for H0: Variable Estimate Error Parameter=0 Prob |T| INTERCEP -16.600 5.794 -2.865 0.0052 NEW 8.999 17.553 0.513 0.6095 SIZE 66.604 3.446 19.328 0.0001 NEW SIZE 4.973 10.015 0.497 0.6208
b) Report the separate prediction equations for the four groups, and sketch a plot of the fitted model.
c) Find the predicted income for an Asian American with 16 years of education.
d) Find the estimated difference between mean incoine for blacks and whites, controlling for education. Compare the estimate to the value obtained without the Asian-American data in the datasct
e) Using the data for all four groups, fit the interaction model. Interpret the parameter estimates.
f) Report the separate prediction lines for the four groups. Compare the lines to the ones for the no interaction inodel. Comment. g) Fit the model relating Y to X using only the data for Asian Americans. Compare to the line for Asian Americans from the interaction model (In fact, the fit of the interac- tion model is necessanly identical to conducting a separate regression analysis for each group) h) Explain how the estimated difference in mean incomes between blacks and whites changes as education changes. i) Report R for this model, and compare to R for the simpler model without interaction. Does this model seem to provide much stronger predictive power?
j) Test the hypothesis of no interaction. Report the test statistic and P-value, and inter- pret. k) Assuming no interaction, test the hypothesis that income is independent of ethnic- racial group, controlling for education. Report the test statistic and P-value, and inter- pret. i) Assuming no interaction. test the hypothesis that income is independent of education, controlling for ethnic-racial group Report the test statistic and P-value, and interpret. m) Report the adjusted mean for blacks. Show how it compares to the unadjusted mean. and explain why the adjustment increased its value. n) Estimate the difference between adjusted means for blacks and whites. Explain how to find this value from the coefficients of the prediction equation. o) Construct a confidence interval for the difference between truc adjusted means of blacks and whites Use the appropriate confidence coefficient for forming simultaneous 94% confidence intervals for all six pairs of differences. Interpret
Step by Step Answer:

This question has not been answered yet.
You can Ask your question!

Statistical Methods For The Social Sciences
ISBN: 9780135265260
3rd Edition
Authors: Alan Agresti, Barbara Finlay
