

9.69.* Suppose that the linear regression model E(y) = + x with normality and constant standard...
Question:
9.69.* Suppose that the linear regression model E(y) = α + βx with normality and constant standard deviation σ is truly appropriate. Then, the interval of numbers
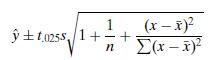
predicts where a new observation on y will fall at that value of x. This interval, which for large n is roughly ˆy ± 2s, is a 95% prediction interval for y. To make an inference about the mean of y (rather than a single value of y) at that value of x, we use the confidence interval
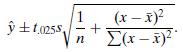
For large n, near ¯x this is roughly ˆy ± 2s/
√
n. The t-value in these intervals is based on df = n − 2. Most software has options for calculating these formulas. Refer to the Houses data file at the text website.
(a) Using software, find a 95% prediction interval for selling price at house size x = 2000.
(b) Using software, find a 95% confidence interval for the mean selling price at house size x = 2000.
(c) Explain intuitively why a prediction interval for a single observation is much wider than a confidence interval for the mean.
(d) Explain how prediction intervals would likely be in error if, in fact, (i) the variability in housing prices tends to increase as house size increases, (ii) the response variable is highly discrete, such as y = number of children in Exercise 9.30.
Step by Step Answer:


Statistical Methods For The Social Sciences
ISBN: 9781292220314
5th Global Edition
Authors: Alan Agresti
