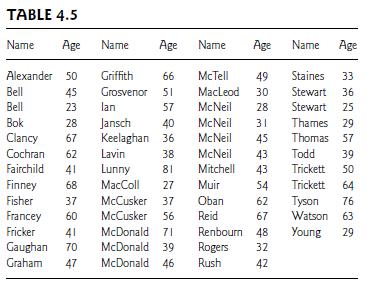
(Class Exercise) Table 4.5 provides the ages of all 50 heads of households in a small Nova...
Question:
(Class Exercise) Table 4.5 provides the ages of all 50 heads of households in a small Nova Scotian fishing village. The data are in the data file Ages at the text website. The distribution of these ages is characterized by
μ = 47.18 and σ = 14.74.
(a) Construct a stem-and-leaf plot or histogram of the population distribution.
(b) Each student should generate nine random numbers between 01 and 50 and use them to sample nine heads of households. Compute their sample mean age. Plot the empirical sampling distribution of the ¯y-values. Compare it to the distribution in (a).
(c) What do you expect for the mean of the ¯y-values in a long run of repeated samples of size 9?
(d) What do you expect for the standard deviation of the
¯y-values in a long run of repeated samples of size 9?

Step by Step Answer:

Statistical Methods For The Social Sciences
ISBN: 9781292220314
5th Global Edition
Authors: Alan Agresti


