

For the number of times a week reading a newspaper, from the Students data file referred to
Question:
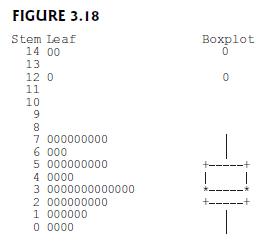
For the number of times a week reading a newspaper, from the Students data file referred to in Exercise 1.11, Figure 3.18 shows software output (rather crude)
of the stem-and-leaf plot and the box plot.
(a) From the box plot, identify the minimum, lower quartile, median, upper quartile, and maximum.
(b) Identify this five-number summary using the stemand-
leaf plot.
(c) Do the data appear to contain any outliers? If so, identify.
(d) The standard deviation is one of the following values—0.3, 3, 13, 23.Which do you think it is, and why?
Step by Step Answer:

This question has not been answered yet.
You can Ask your question!
Related Book For 

Statistical Methods For The Social Sciences
ISBN: 9781292220314
5th Global Edition
Authors: Alan Agresti
Question Posted:
