

Table 10.6 relates occupational level (white collar, blue collar) and political party choice, controlling for income. (a)
Question:
Table 10.6 relates occupational level (white collar, blue collar) and political party choice, controlling for income.
(a) Construct the bivariate table between occupational level and political party, ignoring income. Is there an association? If so, describe it.
(b) Do the partial tables display an association? Interpret them.
(c) Using the nature of the association between income and each of the other variables, explain why the bivariate table has such different association than the partial tables.
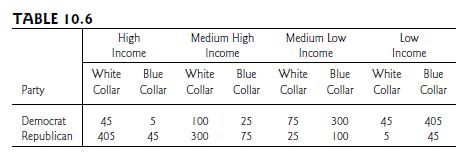
(d) Construct a chain diagram that might explain the relationships, identifying the intervening (i.e., mediator)
variable.
(e) Show that the data are also consistent with a spurious association, and draw the corresponding diagram. Which diagram seems more appropriate?Why?
Step by Step Answer:

This question has not been answered yet.
You can Ask your question!


Statistical Methods For The Social Sciences
ISBN: 9781292220314
5th Global Edition
Authors: Alan Agresti
