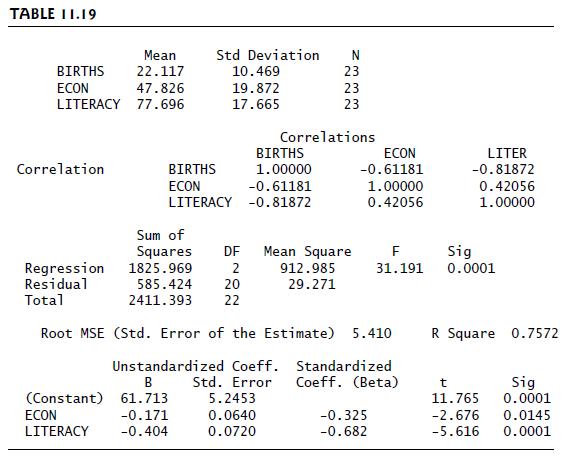
Table 11.19 shows results of regressing y = birth rate (number of births per 1000 population) on
Question:
Table 11.19 shows results of regressing y = birth rate (number of births per 1000 population) on x1 =
women’s economic activity and x2 = literacy rate, using UN data for 23 nations.
(a) Report the value of each of the following:
(i) ryx1, (ii) ryx2, (iii) R2,
(iv) TSS, (v) SSE, (vi) mean square error,
(vii) s, (viii) sy, (ix)se for b1,
(x) t for H0: β1 = 0,
(xi) P for H0: β1 = 0 against Ha: β1 = 0,
(xii) P for H0: β1 = 0 against Ha: β1
(xiii) F for H0: β1 = β2 = 0,
(xiv) P for H0: β1 = β2 = 0.
(b) Report the prediction equation, and interpret the signs of the estimated regression coefficients.
(c) Interpret the correlations ryx1 and ryx2.
(d) Report R2, and interpret its value.

(e) Report the multiple correlation, and interpret.
(f) Though inference may not be relevant for these data, report the F statistic for H0: β1 = β2 = 0, report its Pvalue, and interpret.
(g) Show how to construct the t statistic for H0: β1 = 0, report its df and P-value for Ha: β1 = 0, and interpret.
Step by Step Answer:

Statistical Methods For The Social Sciences
ISBN: 9781292220314
5th Global Edition
Authors: Alan Agresti


