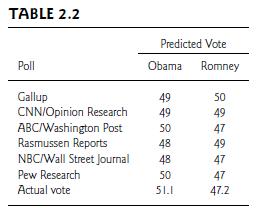
Table 2.2 shows the result of the 2012 Presidential election and the predictions of several organizations in
Question:
Table 2.2 shows the result of the 2012 Presidential election and the predictions of several organizations in the days before the election. The sample sizes were typically about 2000. (The percentages for each poll do not sum to 100 because of voters reporting as undecided or favoring another candidate.)
(a) What factors cause the results to vary somewhat among organizations?
(b) Identify the sampling error for the Gallup Poll.

Fantastic news! We've Found the answer you've been seeking!
Step by Step Answer:
Related Book For 

Statistical Methods For The Social Sciences
ISBN: 9781292220314
5th Global Edition
Authors: Alan Agresti
Question Posted:


