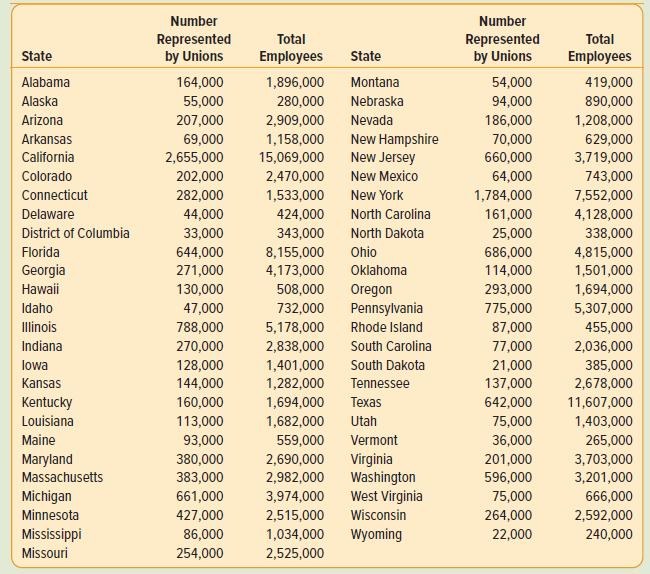
For each U.S. state and the District of Columbia, the following table lists the total employees and
Question:
For each U.S. state and the District of Columbia, the following table lists the total employees and number of total employees represented by unions.

Use statistical software to answer the following questions.a. For Number Represented by Unions, determine the minimum, first quartile, median, third quartile, and maximum values.b. For Number Represented by Unions, determine if any observations are outliers.If so, report the lower and upper outlier boundaries.c. For Number Represented by Unions, plot the data using a box plot.d. For Number Represented by Unions, determine the coefficient of skewness using the software method.e. Comment on the shape of the Number Represented by Unions distribution using your answers to parts (a), (b), (c), and (d).f. Compute and add a variable, Percent of Employees Represented by Unions.g. For Percent of Employees Represented by Unions, determine the minimum, first quartile, median, third quartile, and maximum values.h. For Percent of Employees Represented by Unions, determine if any observations are outliers. If so, report the lower and upper outlier boundaries.i. For Percent of Employees Represented by Unions, plot the data using a box plot.j. For Percent of Employees Represented by Unions, determine the coefficient of skewness using the software method.k. Comment on the shape of the Percent of Employees Represented by Unions distribution using your answers to parts (g), (h), (i), and (j).l. Does Number Represented by Unions or Percent of Employees Represented by Unions better reflect union representation?
Step by Step Answer:

Statistical Techniques In Business And Economics
ISBN: 9781265779696
19th Edition
Authors: Douglas Lind, William Marchal, Samuel Wathen


