1. Look at Figure 4-11, Whos Cracking the Books? (a) Does the figure show the probability distribution...
Question:
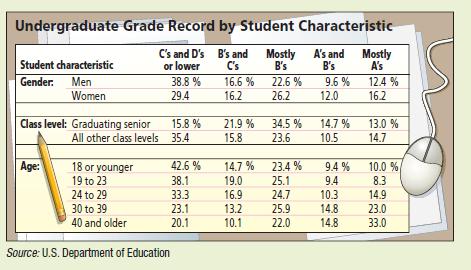
1. Look at Figure 4-11, “Who’s Cracking the Books?”
(a) Does the figure show the probability distribution of grade records for male students? for female students? Describe all the grade-record probability distributions shown in Figure 4-11. Find the probability that a male student selected at random has a grade record showing mostly A’s.

(b) Is the probability distribution shown for all students making mostly A’s?
Explain your answer. Hint: Do the percentages shown for mostly A’s add up to 1? Can Figure 4-11 be used to determine the probability that a student selected at random has mostly A’s? Can it be used to determine the probability that a female student selected at random has mostly A’s? What is the probability?
(c) Can we use the information shown in the figure to determine the probability that a graduating senior has grades consisting of mostly B’s or higher?
What is the probability?
(d) Does Figure 4-11 give sufficient information to determine the probability that a student selected at random is in the age range 19 to 23 and has grades that are mostly B’s? What is the probability that a student selected at random has grades that are mostly B’s, given that he or she is in the age range 19 to 23?
(e) Suppose that 65% of the students at State University are between 19 and 23 years of age. What is the probability that a student selected at random is in this age range and has grades that are mostly B’s?
Step by Step Answer:

Understandable Statistics Concepts And Methods
ISBN: 9781305142909
11th Edition
Authors: Charles Henry Brase, Corrinne Pellillo Brase


