

1. Midterm Scores When a student performs poorly on a midterm exam, the student sometimes is convinced...
Question:
1. Midterm Scores When a student performs poorly on a midterm exam, the student sometimes is convinced they will do much better on the second midterm. The following data show the midterm scores (out of 100 points) for eight students in an introductory statistics class.
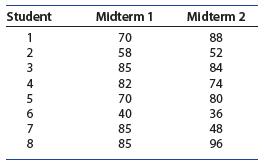
a. Construct a scatterplot for the data.
b. Describe the pattern that you see in the scatterplot.
Are there any clusters or outliers? If so, how would you explain them?
Fantastic news! We've Found the answer you've been seeking!
Step by Step Answer:

Answered By
Nazrin Ziad
I am a post graduate in Zoology with specialization in Entomology.I also have a Bachelor degree in Education.I posess more than 10 years of teaching as well as tutoring experience.I have done a project on histopathological analysis on alcohol treated liver of Albino Mice.
I can deal with every field under Biology from basic to advanced level.I can also guide you for your project works related to biological subjects other than tutoring.You can also seek my help for cracking competitive exams with biology as one of the subjects.
2+ Reviews
10+ Question Solved
Related Book For 

Introduction To Probability And Statistics
ISBN: 9780357114469
15th Edition
Authors: William Mendenhall Iii , Robert Beaver , Barbara Beaver
Question Posted:
