

11. Yield of Wheat Exercise 9 (Chapter 11 Review) presented an analysis of variance of the yields...
Question:
11. Yield of Wheat Exercise 9 (Chapter 11 Review) presented an analysis of variance of the yields of five different varieties of wheat, observed on one plot each at each of six different locations.
The data from this randomized block design are listed here:
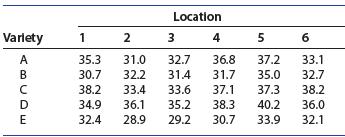
a. Use the Friedman F -test r to determine whether the data provide sufficient evidence to indicate a difference in the yields for the five different varieties of wheat. Test using a 5.05.
b. When the analysis of variance was performed in Chapter 11, the ANOVA F-test produced the test statistic F518.61 with p-value5.000. How do these results compare with results of the Friedman F -test r in part a? Explain.
Step by Step Answer:

This question has not been answered yet.
You can Ask your question!


Introduction To Probability And Statistics
ISBN: 9780357114469
15th Edition
Authors: William Mendenhall Iii , Robert Beaver , Barbara Beaver
