

12. Use a pie chart to describe the distribution of average daily users for the four regions...
Question:
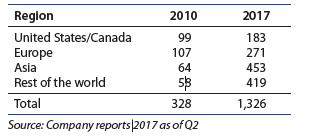
12. Use a pie chart to describe the distribution of average daily users for the four regions in 2017.
The social networking site Facebook has grown rapidly in the last 10 years. The following table shows the average number of daily users (in millions)
as it has grown from 2010 to 2017 in different regions in the world
Fantastic news! We've Found the answer you've been seeking!
Step by Step Answer:

Answered By
PALASH JHANWAR
I am a Chartered Accountant with AIR 45 in CA - IPCC. I am a Merit Holder ( B.Com ). The following is my educational details.
PLEASE ACCESS MY RESUME FROM THE FOLLOWING LINK: https://drive.google.com/file/d/1hYR1uch-ff6MRC_cDB07K6VqY9kQ3SFL/view?usp=sharing
3+ Reviews
10+ Question Solved
Related Book For 

Introduction To Probability And Statistics
ISBN: 9780357114469
15th Edition
Authors: William Mendenhall Iii , Robert Beaver , Barbara Beaver
Question Posted:
