19. Hazardous Waste The number of hazardous waste sites in each of the 50 states and the...
Question:
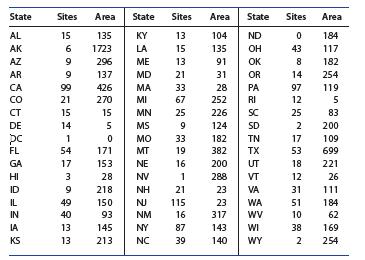
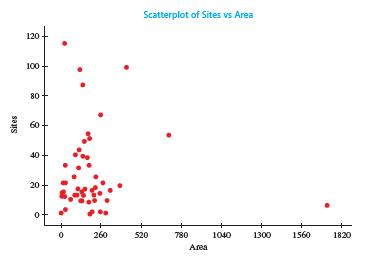
19. Hazardous Waste The number of hazardous waste sites in each of the 50 states and the District of Columbia in 2016 are shown in the following table.10 Researchers also recorded the size of the state (in thousands of square kilometers) and generated a scatterplot of the data.


a. Use the scatterplot to describe the relationship between the number of waste sites and size of the state.
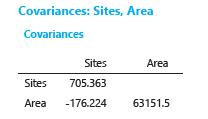
b. Use the MINITAB output to calculate the correlation coefficient. Does this confirm your answer to part a?
c. Write a short paragraph to summarize the data set.
Include any other variables that might be considered in trying to understand the distribution of hazardous waste sites in the United States.
Step by Step Answer:

Introduction To Probability And Statistics
ISBN: 9780357114469
15th Edition
Authors: William Mendenhall Iii , Robert Beaver , Barbara Beaver


