

19. Measuring Over Time A quantitative variable is measured once a year for a 10-year period: a....
Question:
19. Measuring Over Time A quantitative variable is measured once a year for a 10-year period:
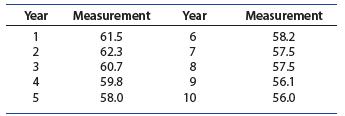
a. Draw a scatterplot to describe the variable as it changes over time.
b. Describe the measurements using the graph constructed in part a.
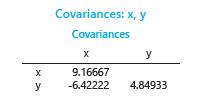
c. Use this MINITAB output to calculate the correlation coefficient, r:
d. Find the best-fitting line using the results of part c.
Verify your answer using the data entry method in your calculator.
e. Plot the best-fitting line on your scatterplot from part a.
Describe the fit of the line.
Step by Step Answer:

This question has not been answered yet.
You can Ask your question!
Related Book For 

Introduction To Probability And Statistics
ISBN: 9780357114469
15th Edition
Authors: William Mendenhall Iii , Robert Beaver , Barbara Beaver
Question Posted:
