

21. Calculating the Mean and the Standard Deviation for Grouped Data Suppose that some measurements occur more
Question:
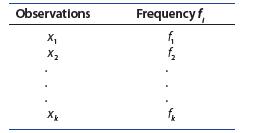
21. Calculating the Mean and the Standard Deviation for Grouped Data Suppose that some measurements occur more than once and that the data , ,…, 1 2 x x xk are arranged in a frequency table as shown here:
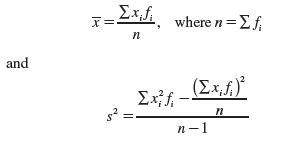
The formulas for the mean and variance for grouped data are
Notice that if each value occurs once, these formulas are identical to those given in the text. Although these formulas for grouped data are primarily of value when you have a large number of measurements, use them for the sample 1, 0, 0, 1, 3, 1, 3, 2, 3, 0, 0, 1, 1, 3, 2.
a. Calculate x and s2 directly, using the formulas for ungrouped data.
b. The frequency table for the n515 measurements is as follows:
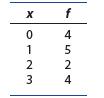
c. Calculate x and s2 using the formulas for grouped data. Compare with your answers to part a.
Step by Step Answer:


Introduction To Probability And Statistics
ISBN: 9780357114469
15th Edition
Authors: William Mendenhall Iii , Robert Beaver , Barbara Beaver
