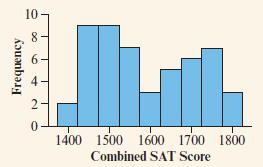
2.123 SAT scores The U.S. statewide average total SAT scores math + reading + writing for 2010...
Question:
2.123 SAT scores The U.S. statewide average total SAT scores math + reading + writing for 2010 are summarized in the box plot. These SAT scores are out of a possible 2400.
(Data available on the book’s website.)

a. Explain how the box plot gives you information about the distribution shape.
b. Using the box plot, give the approximate value for each component of the five-number summary.
Interpret each.
c. A histogram for these data is also shown. What feature of the distribution would be missed by using only the box plot?

Step by Step Answer:
Related Book For 

Statistics The Art And Science Of Learning From Data
ISBN: 9781292164878
4th Global Edition
Authors: Alan Agresti, Christine A. Franklin, Bernhard Klingenberg
Question Posted:


