

2.19 Split Stems The figure below shows the stem-and-leaf plot for the cereal sugar values from Example
Question:
2.19 Split Stems The figure below shows the stem-and-leaf plot for the cereal sugar values from Example 5, using split stems.
Stem and Leaf Plot for Cereal Sugar Values with Leaf Unit = 1000
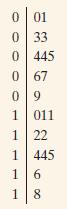
a. What was the smallest and largest amount of sugar found in the 20 cereals?
b. What sugar values are represented on the 6th line of the plot?
c. How many cereals have a sugar content less than 5 g?
Step by Step Answer:

This question has not been answered yet.
You can Ask your question!
Related Book For 

Statistics The Art And Science Of Learning From Data
ISBN: 9781292164878
4th Global Edition
Authors: Alan Agresti, Christine A. Franklin, Bernhard Klingenberg
Question Posted:
