2.55 Shape of cigarette taxes A recent summary for the distribution of cigarette taxes (in cents) among
Question:
2.55 Shape of cigarette taxes A recent summary for the distribution of cigarette taxes (in cents) among the 50 states and Washington, D.C., in the United States reported xQ = 73 and s = 48. Based on these values, do you think that this distribution is bell shaped? If so, why? If not, why not, and what shape would you expect?
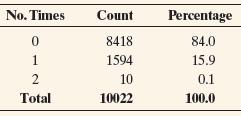
2.56 Empirical rule and skewed, highly discrete distribution The table below shows data (from a 2004 Bureau of the Census report) on the number of times 20- to 24-year-old men have been married.
a. Verify that the mean number of times men have been married is 0.16 and that the standard deviation is 0.37.
b. Find the actual percentages of observations within 1, 2, and 3 standard deviations of the mean. How do these compare to the percentages predicted by the empirical rule?
c. How do you explain the results in part b?
Transcribed Image Text:
No. Times Count Percentage 0 8418 84.0 1 1594 15.9 2 10 0.1 Total 10022 100.0
Fantastic news! We've Found the answer you've been seeking!
Step by Step Answer:
Answer rating: 100% (QA)
Answered By
Ashington Waweru
I am a lecturer, research writer and also a qualified financial analyst and accountant. I am qualified and articulate in many disciplines including English, Accounting, Finance, Quantitative spreadsheet analysis, Economics, and Statistics. I am an expert with sixteen years of experience in online industry-related work. I have a master's in business administration and a bachelor’s degree in education, accounting, and economics options.
I am a writer and proofreading expert with sixteen years of experience in online writing, proofreading, and text editing. I have vast knowledge and experience in writing techniques and styles such as APA, ASA, MLA, Chicago, Turabian, IEEE, and many others.
I am also an online blogger and research writer with sixteen years of writing and proofreading articles and reports. I have written many scripts and articles for blogs, and I also specialize in search engine
I have sixteen years of experience in Excel data entry, Excel data analysis, R-studio quantitative analysis, SPSS quantitative analysis, research writing, and proofreading articles and reports. I will deliver the highest quality online and offline Excel, R, SPSS, and other spreadsheet solutions within your operational deadlines. I have also compiled many original Excel quantitative and text spreadsheets which solve client’s problems in my research writing career.
I have extensive enterprise resource planning accounting, financial modeling, financial reporting, and company analysis: customer relationship management, enterprise resource planning, financial accounting projects, and corporate finance.
I am articulate in psychology, engineering, nursing, counseling, project management, accounting, finance, quantitative spreadsheet analysis, statistical and economic analysis, among many other industry fields and academic disciplines. I work to solve problems and provide accurate and credible solutions and research reports in all industries in the global economy.
I have taught and conducted masters and Ph.D. thesis research for specialists in Quantitative finance, Financial Accounting, Actuarial science, Macroeconomics, Microeconomics, Risk Management, Managerial Economics, Engineering Economics, Financial economics, Taxation and many other disciplines including water engineering, psychology, e-commerce, mechanical engineering, leadership and many others.
I have developed many courses on online websites like Teachable and Thinkific. I also developed an accounting reporting automation software project for Utafiti sacco located at ILRI Uthiru Kenya when I was working there in year 2001.
I am a mature, self-motivated worker who delivers high-quality, on-time reports which solve client’s problems accurately.
I have written many academic and professional industry research papers and tutored many clients from college to university undergraduate, master's and Ph.D. students, and corporate professionals. I anticipate your hiring me.
I know I will deliver the highest quality work you will find anywhere to award me your project work. Please note that I am looking for a long-term work relationship with you. I look forward to you delivering the best service to you.