

2.72 Central Park temperature distribution revisited Exercise 2.26 showed a histogram for the distribution of Central Park
Question:
2.72 Central Park temperature distribution revisited Exercise 2.26 showed a histogram for the distribution of Central Park annual average temperatures. The box plot for these data is shown here.
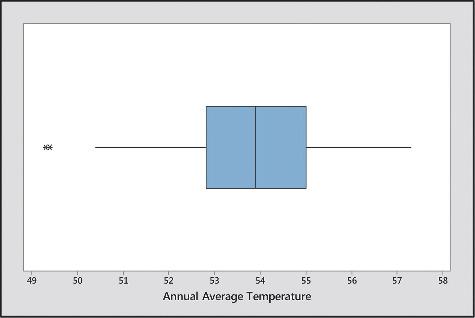
a. If this distribution is skewed, would you expect it to be skewed to the right or to the left? Explain.
b. Approximate each component of the five-number summary and interpret.
Step by Step Answer:

This question has not been answered yet.
You can Ask your question!
Related Book For 

Statistics The Art And Science Of Learning From Data
ISBN: 9781292164878
4th Global Edition
Authors: Alan Agresti, Christine A. Franklin, Bernhard Klingenberg
Question Posted:
