

2.82 CO2 comparison The vertical side-by-side box plots shown below compare per capita carbon dioxide emissions in
Question:
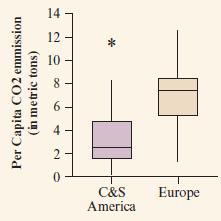
2.82 CO2 comparison The vertical side-by-side box plots shown below compare per capita carbon dioxide emissions in 2011 for many Central and South American and European nations. (Data available on the book’s website. Source: www.eia.gov)
a. Give the approximate value of carbon dioxide emissions for the outliers shown. (There are actually two outliers.)
b. What shape would you predict for the distribution in Central and South America? Why?
c. Summarize how the carbon dioxide emissions compare between the two regions.
Fantastic news! We've Found the answer you've been seeking!
Step by Step Answer:

Answered By
Benard Ndini Mwendwa
I am a graduate from Kenya. I managed to score one of the highest levels in my BS. I have experience in academic writing since I have been working as a freelancer in most of my time. I am willing to help other students attain better grades in their academic portfolio. Thank you.
107+ Reviews
240+ Question Solved
Related Book For 

Statistics The Art And Science Of Learning From Data
ISBN: 9781292164878
4th Global Edition
Authors: Alan Agresti, Christine A. Franklin, Bernhard Klingenberg
Question Posted:
