

4. Demand for Utilities The effect of mean monthly daily temperature 1 x and cost per kilowatthour...
Question:
4. Demand for Utilities The effect of mean monthly daily temperature 1 x and cost per kilowatthour 2 x on the mean daily household consumption of electricity (in kilowatt-hours, kWh) was the subject of a short-term study. The investigators expected the demand for electricity to rise in cold weather (due to heating), fall when the weather was moderate, and rise again when the temperature rose and there was need for air-conditioning.
They expected demand to decrease as the cost per kilowatt-hour increased, reflecting greater attention to conservation. Data were available for 2 years, a period in which the cost per kilowatt-hour 2 x increased because of the increasing cost of fuel. The company fitted the model
![]()
to the data shown in the table. The Excel printout for this multiple regression problem is also provided.
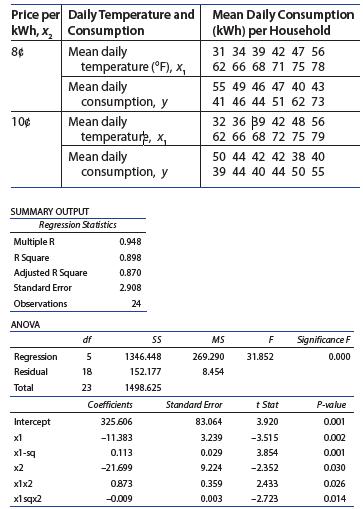
a. Do the data indicate that the model contributes information for the prediction of mean daily kilowatthour consumption per household? Test at the 5%
level of significance.
b. Graph the curve depicting ˆy as a function of temperature 1 x when the cost per kilowatt-hour is 8¢ 2 x 5 .
Construct a similar graph for the case when 10¢ 2 x 5 per kilowatt-hour. Are the consumption curves different?
c. If cost per kilowatt-hour is unimportant in predicting use, then you do not need the terms involving 2 x in the model. Therefore, the null hypothesis H0: x2 does not contribute information for the prediction of y
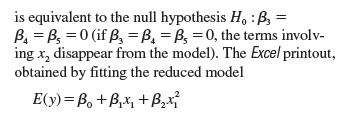
to the data, is shown here. Use the methods of Section 13.5 to determine whether price per kilowatt-
hour 2 x contributes significant information for the prediction of y.
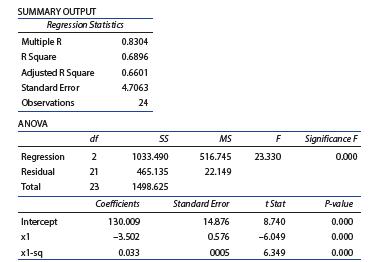
d. Compare the values of R2(adj) for the two models fit in this exercise. Which of the two models would you recommend?
Step by Step Answer:

This question has not been answered yet.
You can Ask your question!


Introduction To Probability And Statistics
ISBN: 9780357114469
15th Edition
Authors: William Mendenhall Iii , Robert Beaver , Barbara Beaver
