

5. Graph the prediction equation over the interval 0# x #10. A Quadratic Model Suppose that you...
Question:
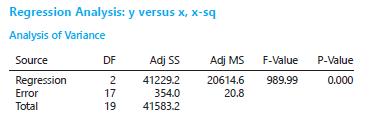
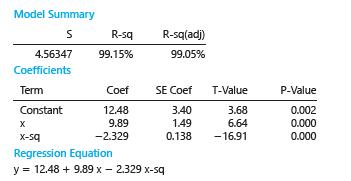
5. Graph the prediction equation over the interval 0# x #10.
A Quadratic Model Suppose that you fitted the model E(y) x x 0 1 2 2 5b 1b 1b to n520 data points and obtained the following MINITAB printout
Step by Step Answer:

This question has not been answered yet.
You can Ask your question!
Related Book For 

Introduction To Probability And Statistics
ISBN: 9780357114469
15th Edition
Authors: William Mendenhall Iii , Robert Beaver , Barbara Beaver
Question Posted:
