

6. Criminal Justice: Prisoners The time plot in Figure 2-18 gives the number of state and federal...
Question:
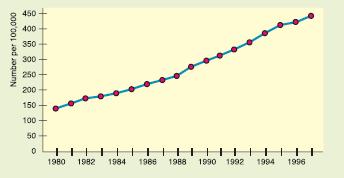
6. Criminal Justice: Prisoners The time plot in Figure 2-18 gives the number of state and federal prisoners per 100,000 population (Source: Statistical Abstract of the United States, 120th Edition).
(a) Estimate the number of prisoners per 100,000 people for 1980 and for 1997.
(b) Interpretation During the time period shown, there was increased prosecution of drug offenses, longer sentences for common crimes, and reduced access to parole. What does the time-series graph say about the prison population change per 100,000 people?
(c) In 1997, the U.S. population was approximately 266,574,000 people. At the rate of 444 prisoners per 100,000 population, about how many prisoners were in the system? The projected U.S. population for the year 2020 is 323,724,000. If the rate of prisoners per 100,000 stays the same as in 1997, about how many prisoners do you expect will be in the system in 2020? To obtain the most recent information, visit the Brase/Brase statistics site at http://www.cengage.com/statistics/brase11e and find the link to the Census Bureau.
Step by Step Answer:

This question has not been answered yet.
You can Ask your question!


Understandable Statistics Concepts And Methods
ISBN: 9781305142909
11th Edition
Authors: Charles Henry Brase, Corrinne Pellillo Brase
