

6.17 Probability in graph For the normal distributions shown below, use Table A, software, or a calculator
Question:
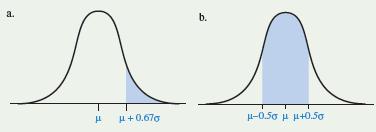
6.17 Probability in graph For the normal distributions shown below, use Table A, software, or a calculator to find the probability that an observation falls in the shaded region.
Step by Step Answer:

This question has not been answered yet.
You can Ask your question!
Related Book For 

Statistics The Art And Science Of Learning From Data
ISBN: 9781292164878
4th Global Edition
Authors: Alan Agresti, Christine A. Franklin, Bernhard Klingenberg
Question Posted:
