Activity: Sampling the states This activity illustrates how sampling bias can result when you use a nonrandom
Question:
Activity: Sampling the states This activity illustrates how sampling bias can result when you use a nonrandom sample, even if you attempt to make it representative:
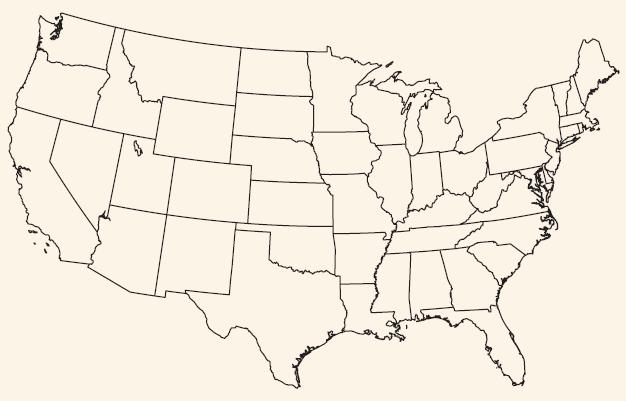
You are in a geography class, discussing center and variability for several characteristics of the states in the contiguous United States. A particular value of center is the mean area of the states. A map and a list of the states with their areas (in square miles) are shown in the figure and table that follow. Area for a state includes dry land and permanent inland water surface.
Although we could use these data to calculate the actual mean area, let’s explore how well sampling performs in estimating the mean area by sampling five states and finding the sample mean.
a. The most convenient sampling design is to use our eyes to pick five states from the map that we think have areas representative of all the states. Do this, picking five states that you believe have areas representative of the actual mean area of the states.
Compute their sample mean area.
b. Collect the sample means for all class members.
Construct a dot plot of these means. Describe the distribution of sample means. Note the shape, center, and variability of the distribution.
c. Another possible sampling design is simple random sampling. Randomly select five states (using an app or computer program) and compute the sample mean area.
d. Collect the sample means from part c of all class members. Construct a dot plot of the sample means using the same horizontal scale as in part
b. Describe this distribution of sample means. Note the shape, center, and variability of the distribution.
e. The true mean total land area for the 48 states can be calculated from the accompanying table by dividing the total at the bottom of the table by 48. Which sampling method, using your eyes or using random selection, tended to be better at estimating the true population mean? Which method seems to be less biased? Explain.
f. Write a short summary comparing the two distributions of sample means.

Map of the continental United States.
Areas of the 48 States in the Continental U.S.
State Area (square miles)
Alabama 52,419 Arizona 113,998 Arkansas 53,179 California 163,696 Colorado 104,094 Connecticut 5,543 Delaware 2,489 Florida 65,755 Georgia 59,425 Idaho 83,570 Illinois 57,914 Indiana 36,418 Iowa 56,272 Kansas 82,277 Kentucky 40,409 Louisiana 51,840 Maine 35,385 Maryland 12,407 Massachusetts 10,555 Michigan 96,716 Minnesota 86,939 Mississippi 48,430 Missouri 69,704 Montana 147,042 Nebraska 77,354 Nevada 110,561 New Hampshire 9,350 New Jersey 8,721 New Mexico 121,589 New York 54,556 North Carolina 53,819 North Dakota 70,700 Ohio 44,825 Oklahoma 69,898 Oregon 98,381 Pennsylvania 46,055 Rhode Island 1,545 South Carolina 32,020 South Dakota 77,116 Tennessee 42,143 Texas 268,581 Utah 84,899 Vermont 9,614 Virginia 42,774 Washington 71,300 West Virginia 24,230 Wisconsin 65,498 Wyoming 97,814 U.S. TOTAL 3,119,819
Step by Step Answer:

Statistics The Art And Science Of Learning From Data
ISBN: 9781292164878
4th Global Edition
Authors: Alan Agresti, Christine A. Franklin, Bernhard Klingenberg


