

Auto Insurance: Interpret Graphs Consumer Reports rated automobile insurance companies and listed annual premiums for top-rated companies
Question:
Auto Insurance: Interpret Graphs Consumer Reports rated automobile insurance companies and listed annual premiums for top-rated companies in several states. Figure 3-13 shows box-and-whisker plots for annual premiums for urban customers
(married couple with one 17-year-old son) in three states. The box-and-whisker plots in Figure 3-13 were all drawn using the same scale on a TI-84Plus/
TI-83Plus/TI-Nspire calculator.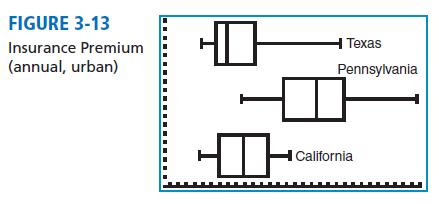
(a) Which state has the lowest premium? The highest?
(b) Which state has the highest median premium?
(c) Which state has the smallest range of premiums?
The smallest interquartile range?
(d) Figure 3-14 gives the five-number summaries generated on the TI-84Plus/TI-83Plus/TI-Nspire calculators for the box-and-whisker plots of Figure 3-13. Match the five-number summaries to the appropriate box-and-whisker plots.AppendixLO1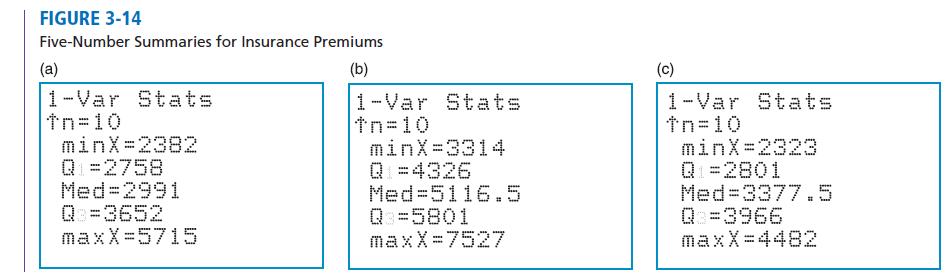
Step by Step Answer:


Understandable Statistics Concepts And Methods
ISBN: 9780357719176
13th Edition
Authors: Charles Henry Brase, Corrinne Pellillo Brase
