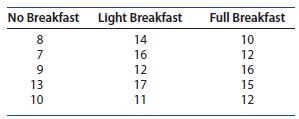
(Completely Randomized Design) Refer to the breakfast study in Example 11.4, in which the effect of nutrition...
Question:
(Completely Randomized Design) Refer to the breakfast study in Example 11.4, in which the effect of nutrition on attention span was studied.

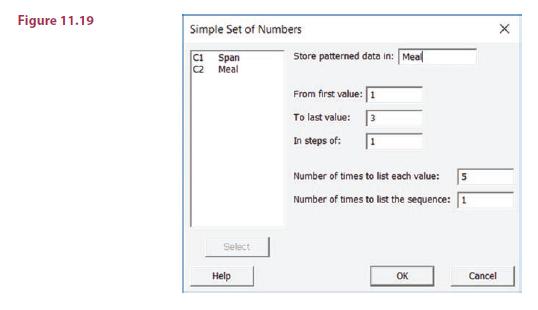
1. Enter the 15 recorded attention spans in column C1 of a MINITAB worksheet and name them “Span.” Next, enter the integers 1, 2, and 3 into a second column C2 to identify the meal assignment (treatment) for each observation. You can let MINITAB set this pattern for you using Calc ➤ Make Patterned Data ➤ Simple Set of Numbers and entering the appropriate numbers, as shown in Figure 11.19

2. Use Stat ➤ ANOVA ➤ One-Way to generate the Dialog box in Figure 11.20(a). In the drop-down list, choose “Response data are in one column for all factor levels.”† Select the column of observations for the “Response” box and the column of treatment indicators for the “Factor” box.
3. Now you have several options. Under Comparisons, you can select “Tukey” (which has a default level of 5%) and select the box marked “Tests” (under “Results”) to obtain paired comparisons output. Under Graphs, you can select individual value plots and/or box plots to compare the three meal assignments, and you can generate residual plots (use “Normal probability plot of residuals” and/or “Residuals versus fits”) to verify the validity of the ANOVA assumptions. Click OK from the main Dialog box to obtain the output in Figure 11.20(b).
4. The observed value of the test statistic F 54.93 is found in the row labeled “Meal” followed by the p-value5.027. With a 5.05, there is a significant difference in the average attention spans depending on the type of breakfast
Step by Step Answer:

Introduction To Probability And Statistics
ISBN: 9780357114469
15th Edition
Authors: William Mendenhall Iii , Robert Beaver , Barbara Beaver


