

Refer to Table 12.1, in which the relationship between x5mathematics achievement test score and y5final calculus grade
Question:
Refer to Table 12.1, in which the relationship between x5mathematics achievement test score and y5final calculus grade was studied.
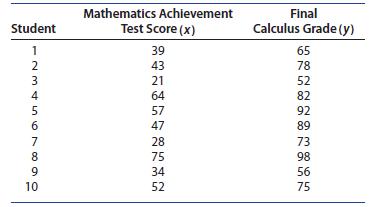
Enter the values for x and y into columns A and B of an Excel spreadsheet.
1. Use Data ➤ Data Analysis ➤ Regression to generate the Dialog box in Figure 12.18(a).
Highlight or type in the cell ranges for the x and y values and check “Labels” if necessary.
2. If you click “Confidence Level,” Excel will calculate confidence intervals for the regression estimates, a and
b. Enter a cell location for the Output Range and click OK.
3. The output will appear in the selected cell location, and should be adjusted using Format ➤ AutoFit Column Width on the Home tab in the Cells group while it is still highlighted.
You can decrease the decimal accuracy if you like, using on the Home tab in the Number group (see Figure 12.18(b)).
4. The output in Figure 12.18
(b) can also be found in Figures 12.6
(b) and 12.7(b), with its interpretation found in Sections 12.2 and 12.3 of the text.
Step by Step Answer:


Introduction To Probability And Statistics
ISBN: 9780357114469
15th Edition
Authors: William Mendenhall Iii , Robert Beaver , Barbara Beaver
