

Residual Plot Recall that residual plots are one way to assess how well a least-squares line fits
Question:
Residual Plot Recall that residual plots are one way to assess how well a least-squares line fits a set of data. The residual is y 2yˆ, the difference between the actual y value and the y value predicted by the least-squares line. In a residual plot, we plot the x coordinates on the horizontal axis and the residuals on the vertical axis. The accompanying figure shows a residual plot for the data of Guided Exercise 4, in which the relationship between the number of ads run per week and the number of cars sold that week was explored. To make the residual plot, first compute all the residuals. Remember that x and y are the given data values, and yˆ is computed from the least-squares line yˆ
Residual Residual x y yˆ y 2yˆ x y yˆ y 2yˆ
6 15 12.6 2.4 16 20 22.7 −2.7 20 31 26.8 4.2 28 40 34.8 5.2 0 10 6.6 3.4 18 25 24.7 0.3 14 16 20.7 −4.7 10 12 16.7 −4.7 25 28 31.8 −3.8 8 15 14.6 0.4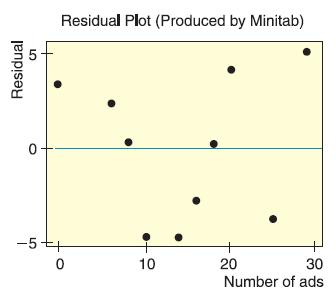
(a) If the least-squares line provides a reasonable model for the data, the pattern of points in the plot will seem random and unstructured about the horizontal line at 0. Is this the case for the residual plot?
(b) If a point on the residual plot seems far outside the pattern of other points, it might reflect an unusual data point (x, y), called an outlier. Such points may have quite an influence on the least-squares model. Do there appear to be any outliers in the data for the residual plot?
AppendixLO1
Step by Step Answer:

This question has not been answered yet.
You can Ask your question!


Understandable Statistics Concepts And Methods
ISBN: 9780357719176
13th Edition
Authors: Charles Henry Brase, Corrinne Pellillo Brase
