

Question: (a) Use six rectangles to find estimates of each type for the area under the given graph of f from x 0 to x
(a) Use six rectangles to find estimates of each type for the area under the given graph of f from x − 0 to x − 12.
(i) L6 (sample points are left endpoints)
(ii) R6 (sample points are right endpoints)
(iii) M6 (sample points are midpoints)
(b) Is L6 an underestimate or overestimate of the true area?
(c) Is R6 an underestimate or overestimate of the true area?
(d) Which of the numbers L6, R6, or M6 gives the best estimate? Explain.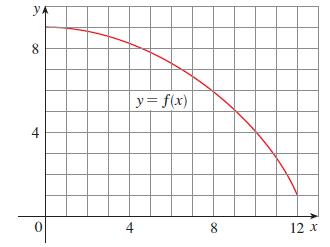
4 8 YA 0 4 | y= f(x) 8 12 x
Step by Step Solution
There are 3 Steps involved in it
1 Expert Approved Answer
Step: 1 Unlock

Question Has Been Solved by an Expert!
Get step-by-step solutions from verified subject matter experts
Step: 2 Unlock
Step: 3 Unlock