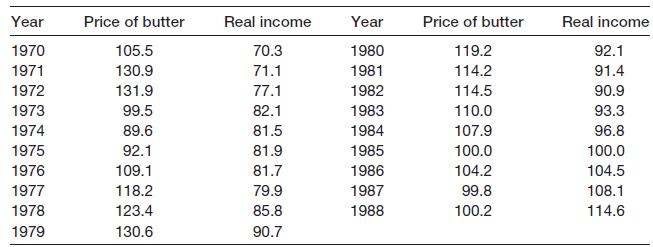
The following data show the real price of butter and real incomes, to supplement the data in
Question:
The following data show the real price of butter and real incomes, to supplement the data in Problem 7.2.

(a) Estimate a multiple regression model of the demand for margarine. Do the coefficients have the expected signs?
(b) Test the significance of the individual coefficients and of the regression as a whole.
(c) Should the model be simplified?
(d) Calculate the elasticity of demand. How does it differ from your earlier answer?
(e) Estimate the cross-price demand elasticity.
(f ) Should other variables be added to improve the model, in your view?
Fantastic news! We've Found the answer you've been seeking!
Step by Step Answer:
Related Book For 

Statistics For Economics Accounting And Business Studies
ISBN: 978027368308
4th Edition
Authors: Michael Barrow
Question Posted:


