

Question: A windmill is used to generate direct current. Data are collected on 45 different days to determine the relationship between wind speed in mi/h (x)
A windmill is used to generate direct current. Data are collected on 45 different days to determine the relationship between wind speed in mi/h (x) and current in kA (y). The data are presented in the following table.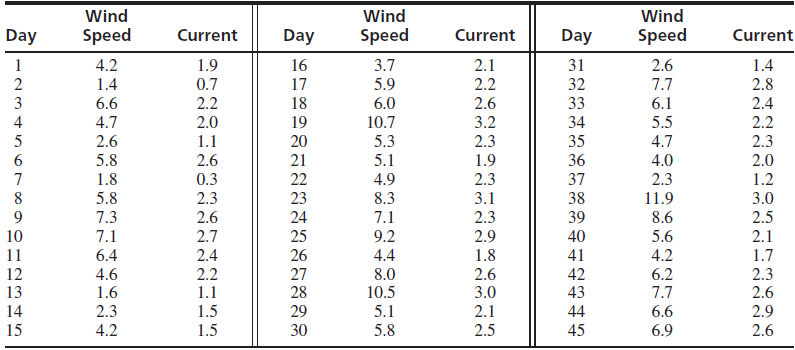
a. Compute the least-squares line for predicting y from x. Make a plot of residuals versus fitted values.
b. Compute the least-squares line for predicting y from ln x. Make a plot of residuals versus fitted values.
c. Compute the least-squares line for predicting ln y from x. Make a plot of residuals versus fitted values.
Wind Wind Wind Speed Speed Speed Day Current Day Current Day Current 4.2 1.4 3.7 5.9 2.1 1.9 16 31 2.6 1.4 7.7 2.8 0.7 17 2.2 32 3 6.6 2.2 18 6.0 2.6 33 6.1 2.4 4 4.7 2.0 19 10.7 3.2 34 5.5 2.2 35 5.3 2.6 1.1 20 2.3 4.7 2.3 5.8 36 37 6. 2.6 21 5.1 1.9 4.0 2.0 1.8 0.3 22 4.9 2.3 2.3 1.2 11.9 5.8 2.3 23 8.3 3.1 38 3.0 9. 7.3 2.6 24 7.1 2.3 39 8.6 2.5 7.1 10 2.7 25 9.2 2.9 40 5.6 2.1 11 6.4 2.4 26 4.4 1.8 41 4.2 1.7 12 2.2 2.6 4.6 1.6 27 28 8.0 10.5 42 43 6.2 7.7 2.3 2.6 13 1.1 3.0 14 2.3 1.5 29 5.1 2.1 44 6.6 2.9 4.2 2.5 15 1.5 30 5.8 45 6.9 2.6
Step by Step Solution
3.45 Rating (177 Votes )
There are 3 Steps involved in it
a The model is log 10 y 0 1 log 10 x Note that the natural log ln could be us... View full answer

Get step-by-step solutions from verified subject matter experts