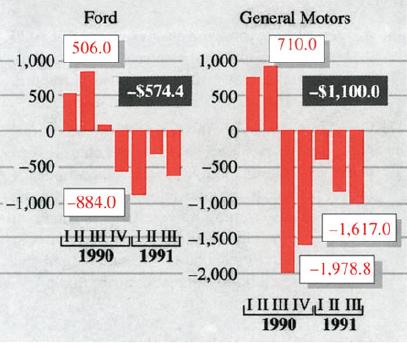
On November 9, 1991, the Home News of central New Jersey used the bar chart given in
Question:
On November 9, 1991, the Home News of central New Jersey used the bar chart given in the accompanying figure to show quarterly net income or losses for both Ford and GM.
(a) Comment on the possible implications of this bar chart.
(b) If you were a stock broker, would you recommend that your client buy either Ford’s or GM’s stock now?
Fantastic news! We've Found the answer you've been seeking!
Step by Step Answer:
Related Book For 

Statistics For Business And Financial Economics
ISBN: 9781461458975
3rd Edition
Authors: Cheng Few Lee , John C Lee , Alice C Lee
Question Posted:


