Refer to the x- and R-charts, Exercises 16.15 and 16.24. Conduct a runs analysis to detect any
Question:
Refer to the x̅- and R-charts, Exercises 16.15 and 16.24. Conduct a runs analysis to detect any trend in the process.
Data from Exercise 16.15
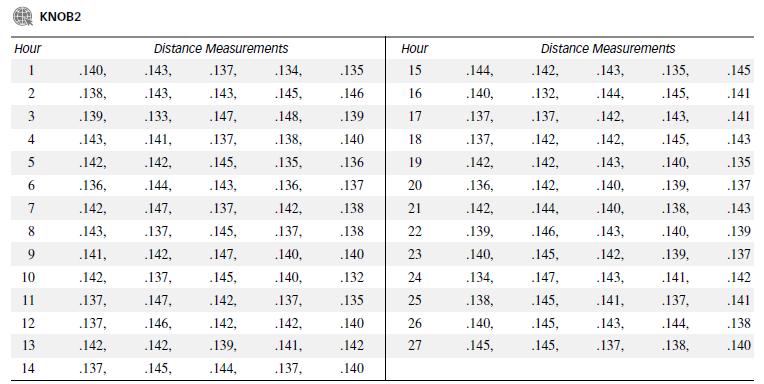
Refer to the manufacture of a rheostat knob, Exercise 16.7. To monitor the process mean, five knobs from each hour’s production were randomly sampled and the distance from the back of the knob to the far side of a pin hole was measured on each. The measurements (in inches) for the first 27 hours the process was in operation are shown in the table below.

Data from Exercise 16.7
A rheostat knob, produced by plastic molding, contains a metal insert. The fit of this knob into its assembly is determined by the distance from the back of the knob to the far side of a pin hole. To monitor the molding operation, one knob from each hour’s production was randomly sampled and the dimension measured on each. The next table (p. 896) gives the distance measurements (in inches) for the first 27 hours the process was in operation.
Step by Step Answer:

Statistics For Engineering And The Sciences
ISBN: 9781498728850
6th Edition
Authors: William M. Mendenhall, Terry L. Sincich


