

11.38 A utility company of a major city reported the average utility bills listed in the table...
Question:
11.38 A utility company of a major city reported the average utility bills listed in the table below for a standard-size home during the last year.
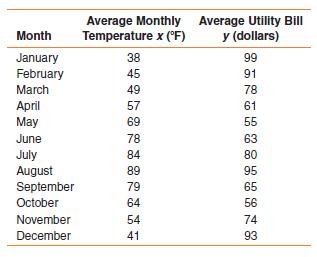
a Plot the points in a scatterplot.
b Use the methods of Chapter 9 to fit the model What do you conclude about the utility of this model?
c Hypothesize another model that might better describe the relationship between the average utility bill and average temperature. If you have access to a computer package, fit the model and test its utility.
Step by Step Answer:

This question has not been answered yet.
You can Ask your question!
Related Book For 

Probability And Statistics For Engineers
ISBN: 9781133006909
5th Edition
Authors: Richard L Scheaffer, Madhuri Mulekar, James T McClave, Cecie Starr
Question Posted:
