

1.17 The back-to-back histogram (often called a population pyramid) shown in Figure below displays the age distributions...
Question:
1.17 The back-to-back histogram (often called a population pyramid) shown in Figure below displays the age distributions of the U.S. population in 1890 and 2005 (projected by U.S. Census Bureau, Statistical Abstract of the United States, 2001).
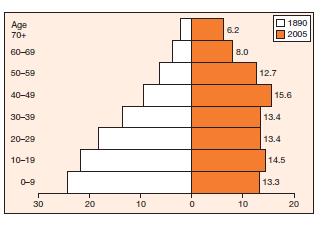
a Is the age distribution of the U.S. population changing? If so, what might that say about our quality of life in future years?
b Approximately what percentage of the population was under age 30 in 1890? In 2005?
c How would you describe the major changes in the age distribution over this century?
Fantastic news! We've Found the answer you've been seeking!
Step by Step Answer:

Answered By
Mario Alvarez
I teach Statistics and Probability for students of my university ( Univerisity Centroamerican Jose Simeon Canas) in my free time and when students ask for me, I prepare and teach students that are in courses of Statistics and Probability. Also I teach students of the University Francisco Gavidia and Universidad of El Salvador that need help in some topics about Statistics, Probability, Math, Calculus. I love teaching Statistics and Probability! Why me?
** I have experience in Statistics and Probability topics for middle school, high school and university.
** I always want to share my knowledge with my students and have a great relationship with them.
** I have experience working with students online.
** I am very patient with my students and highly committed with them
1+ Reviews
10+ Question Solved
Related Book For 

Probability And Statistics For Engineers
ISBN: 9781133006909
5th Edition
Authors: Richard L Scheaffer, Madhuri Mulekar, James T McClave, Cecie Starr
Question Posted:
