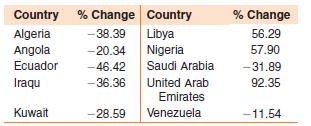
1.21 The data in table below show the percent change in the crude oil imports into the...
Question:
1.21 The data in table below show the percent change in the crude oil imports into the United States from January 2009 to June 2009 for each of the OPEC countries from which oil is imported:
(http://www.eia.doe.gov). The crude oil imports are recorded in thousand barrels per month.
 a Construct a dotplot for the percent change in the crude oil import.
b Calculate the mean and the standard deviation of the percent change in the crude oil import.
c Calculate the median and the interquartile range of the percent change in the crude oil import.
d Do the mean and standard deviation offer good descriptions of center and variation?
Why or why not? The United Arab Emirates contribution changed by 92% over 6 months.
United Arab Emirates’ contribution to the U.S.
crude oil imports is very small (less than 3% in Jan. 2009), even with the increased supply (6% in June 2009). Eliminate this unusual measurement and repeat parts
(b) and (c)
with the reduced dataset. Comment on the effect this unusually large measurement has on the mean and standard deviation.
Step by Step Answer:

Probability And Statistics For Engineers
ISBN: 9781133006909
5th Edition
Authors: Richard L Scheaffer, Madhuri Mulekar, James T McClave, Cecie Starr


