

12.57 The data shown in the table below: are for a factorial experiment with two observations per...
Question:
12.57 The data shown in the table below: are for a factorial experiment with two observations per factor-level combination.
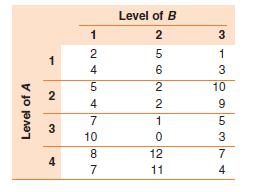
a Perform an analysis of variance for the data and display the results in an analysis of variance table.
b Do the data provide sufficient information to indicate an interaction between the factors?
Test by using 0.05.
c Suppose the objective of the experiment is to select the factor-level combination with the largest mean. Based on the data and using a simultaneous confidence coefficient of approximately 0.90, which pairs of means appear to differ?
Fantastic news! We've Found the answer you've been seeking!
Step by Step Answer:

Answered By
Utsab mitra
I have the expertise to deliver these subjects to college and higher-level students. The services would involve only solving assignments, homework help, and others.
I have experience in delivering these subjects for the last 6 years on a freelancing basis in different companies around the globe. I am CMA certified and CGMA UK. I have professional experience of 18 years in the industry involved in the manufacturing company and IT implementation experience of over 12 years.
I have delivered this help to students effortlessly, which is essential to give the students a good grade in their studies.
2+ Reviews
10+ Question Solved
Related Book For 

Probability And Statistics For Engineers
ISBN: 9781133006909
5th Edition
Authors: Richard L Scheaffer, Madhuri Mulekar, James T McClave, Cecie Starr
Question Posted:
