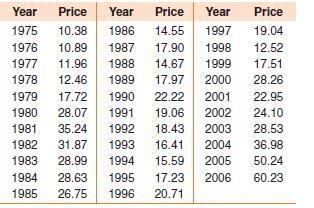
2.12 Table below gives the crude oil prices in U.S. dollars per barrel for years 19752006 (U.S....
Question:
2.12 Table below gives the crude oil prices in U.S.
dollars per barrel for years 1975–2006 (U.S.
Census Bureau, Statistical Abstract of the United States, 2008).

a Display this data using a time series plot.
b Identify any trends in the crude oil prices.
c Identify any peaks or troughs or sudden changes in the crude oil prices. Associate them with then current events that lead to such sudden price changes.
Step by Step Answer:
Related Book For 

Probability And Statistics For Engineers
ISBN: 9781133006909
5th Edition
Authors: Richard L Scheaffer, Madhuri Mulekar, James T McClave, Cecie Starr
Question Posted:


