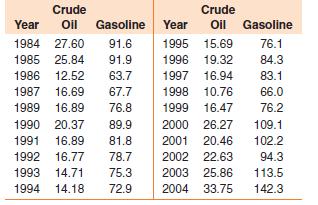
2.51 Table below lists the U.S. retail gasoline price (cents per gallon) and U.S. FOB cost of...
Question:
2.51 Table below lists the U.S. retail gasoline price
(cents per gallon) and U.S. FOB cost of crude oil
(dollars per barrel) as reported by the U.S.
Energy Information Administration (http://www
.eia.doe.gov/).

a Construct a scatterplot of gasoline prices versus crude oil prices. Describe the nature of the relation.
b Estimate the relation using the least-squares technique.
c Construct a residual plot.
d Comment on the appropriateness of the linear relation between gasoline and crude oil prices.
for different parameter (xa) values are reported in table below (read from a chart).

a Fit a simple linear regression model to the relation between the stress and the parameter xa.
b Assess the strength of the estimated relation.
c Is a linear or nonlinear model more appropriate?
d Using the model you choose, predict the hoop stress level for xa 0.30.
Step by Step Answer:

Probability And Statistics For Engineers
ISBN: 9781133006909
5th Edition
Authors: Richard L Scheaffer, Madhuri Mulekar, James T McClave, Cecie Starr


