

6.72 The cumulative proportions of age groups of U.S. residents are shown in table below for years...
Question:
6.72 The cumulative proportions of age groups of U.S. residents are shown in table below for years 1900 and 2000.
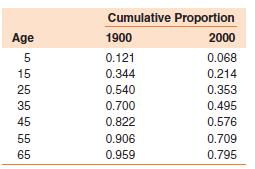
a Construct a Q–Q plot for each year. Use these plots as a basis for discussing key differences between the two age distributions.
b Each of the Q–Q plots should show some departures from normality. Explain the nature of these departures.
Step by Step Answer:

This question has not been answered yet.
You can Ask your question!
Related Book For 

Probability And Statistics For Engineers
ISBN: 9781133006909
5th Edition
Authors: Richard L Scheaffer, Madhuri Mulekar, James T McClave, Cecie Starr
Question Posted:
