Question:
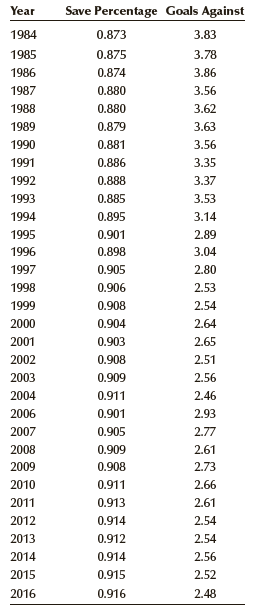
It won€™t come as a surprise to hockey fans that with each passing season the number of goals scored is decreasing. Many experts blame goalie equipment. The oversized pads and other protection for goalies now makes even relatively small goalies look like 250-pound athletes. To learn more about the problem a statistics practitioner recorded the save percentage (the percentage of shots that a goalie saves) and the goals against average (the average number of goals allowed) for each season between 1984 and 2016. These data are listed here.
a. Draw a line chart of the save percentage
b. Draw a line chart of the goals against average

Transcribed Image Text:
Save Percentage Goals Against Year 1984 0.873 3.83 0.875 1985 3.78 1986 0.874 3.86 1987 0.880 3.56 3.62 1988 0.880 1989 0.879 3.63 1990 0.881 3.56 1991 0.886 3.35 1992 0.888 3.37 1993 0.885 3.53 1994 0.895 3.14 2.89 1995 0.901 1996 0.898 3.04 1997 0.905 2.80 1998 0.906 2.53 1999 0.908 2.54 2000 0.904 2.64 2001 0.903 2.65 0.908 2002 2.51 0.909 2003 2.56 2004 0.911 2.46 0.901 2006 2.93 2007 0.905 2.77 2008 0.909 2.61 2009 2.73 0.908 2010 0.911 2,66 2011 0.913 2.61 2,54 2012 0.914 2013 0.912 2.54 2014 0.914 2.56 2015 0.915 2.52 2016 0.916 2.48


