

Question: The file Silver contains the following prices in London for an ounce of silver (in US$) on the last day of the year from 1999
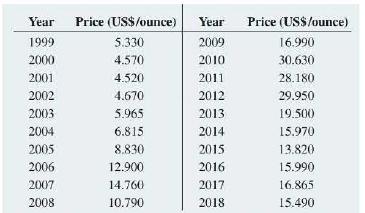
The file Silver contains the following prices in London for an ounce of silver (in US$) on the last day of the year from 1999 to 2018:
a. Plot the data.
b. Compute a linear trend forecasting equation and plot the trend li ne.
c. Compute a quadratic trend forecasting equation and plot the results.
d. Compute an exponential trend forecasting equation and plot the results.
e. Which model is the most appropriate?
f. Using the most appropriate model, forecast the price of silver at the end of 2019.
Year Price (USS/ounce) Price (USS/ounce) Year 1999 5.330 2009 16.990 2000 4.570 2010 30.630 2001 4.520 2011 28.180 2002 4.670 2012 29.950 2003 5.965 2013 19.500 2004 6.815 2014 15.970 2005 8.830 2015 13.820 2006 12.900 2016 15.990 2007 14.760 2017 16.865 2008 10.790 2018 15.490
Step by Step Solution
3.35 Rating (170 Votes )
There are 3 Steps involved in it
a Plot the Data The scatter plot below visualizes silver prices in USounce from 1999 to 2018 Refer t... View full answer

Get step-by-step solutions from verified subject matter experts