

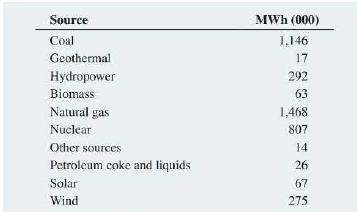
Question: The following table, stored in Energy Sources, contains the 2018 sources of electricity in the United States as reported by the Energy Information Administration. a.
The following table, stored in Energy Sources, contains the 2018 sources of electricity in the United States as reported by the Energy Information Administration.
a. Construct a Pareto chart.
b. What percentage of power is derived from coal, nuclear, or natural gas?
c. Construct a pie chart.
d. For this table data, do you prefer using a Pareto chart or a pie chart? Why?
Source MWh (000) Coal 1,146 Geothermal 17 Hydropower 292 Biomass 63 Natural gas 1,468 Nuclear 807 Other sources 14 Petroleum coke and liquids 26 Solar 67 Wind 275
Step by Step Solution
3.34 Rating (154 Votes )
There are 3 Steps involved in it
Based on the provided table data lets go through the items youve listed a Construct a Pareto chart To construct a Pareto chart you would typically order the categories from the largest to smallest amo... View full answer

Get step-by-step solutions from verified subject matter experts