

Question: Results from the Student Survey Data 1.1 on page 4 describes a dataset giving results of a student survey. We use the students who filled
Results from the Student Survey Data 1.1 on page 4 describes a dataset giving results of a student survey. We use the students who filled out the survey as a sample from the population of all students at that university. Answer the following questions using the computer output which follows the exercise. Justify your answers to the questions using specific values from the computer output. In particular, for all tests, give the null and alternative hypotheses, the p-value from the computer output, and the conclusion in context.
(a) Nationally, about 20% of people smoke. What percent of students in the sample smoke? Is the percent of all students at this university who smoke different from the national percentage?
(b) Is the average math SAT score of students at this university greater than 600?
(c) One of the variables in the dataset is Higher- SAT, which indicates whether the math or the verbal SAT score was higher for each student. What is the proportion of females in the sample with a higher verbal SAT score? What is the proportion of males for whom the verbal score is higher? Is the proportion for whom verbal is higher different between males and females for all students at this university? In addition to the test, state and interpret a 95% confidence interval for the gender effect: the difference between the proportion of females with a higher verbal score minus the proportion of males with a higher verbal score.
(d) Who has a higher average pulse rate in the sample: smokers or non-smokers? Is there evidence of a difference in mean pulse rate between smokers and non-smokers for all students at this university?
(e) Who has a higher mean GPA (grade point average) in the sample: smokers or non-smokers? Is there evidence of a difference in mean GPA between smokers and non-smokers for all students at this university? Are the results significant at a 10% level? At a 5% level? At a 1% level?
Data 1.1
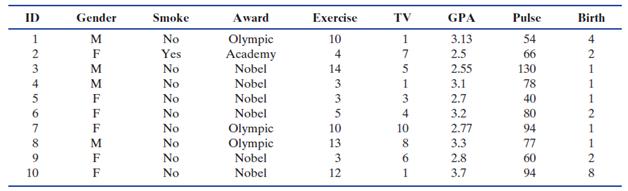
For several years, a first-day survey has been administered to students in an introductory statistics class at one university. Some of the data for a few of the students are displayed in Table 1.1. A more complete table with data for 362 students and 17 variables can be found in the file StudentSurvey.
Table 1.1.
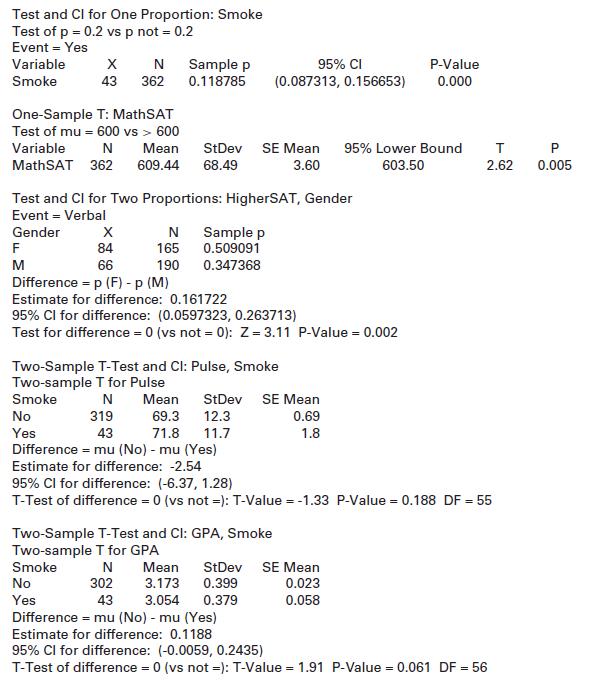
Test and Cl for One Proportion: Smoke Test of p = 0.2 vs p not = Event = Yes 0.2 Variable Sample p 95% CI P-Value Smoke 43 362 0.118785 (0.087313, 0.156653) 0.000 One-Sample T: MathSAT Test of mu = 600 vs > 600 Variable N Mean StDev SE Mean 95% Lower Bound T P MathSAT 362 609.44 68.49 3.60 603.50 2.62 0.005 Test and Cl for Two Proportions: HigherSAT, Gender Event = Verbal Sample p 0.509091 Gender X F 84 165 M 66 190 0.347368 Difference = p (F) - p (M) Estimate for difference: 0.161722 95% Cl for difference: (0.0597323, 0.263713) Test for difference = 0 (vs not = 0): Z= 3.11 P-Value = 0.002 Two-Sample T-Test and Cl: Pulse, Smoke Two-sample T for Pulse Smoke Mean StDev SE Mean No 319 69.3 12.3 0.69 Yes 43 71.8 11.7 1.8 Difference = mu (No) - mu (Yes) Estimate for difference: -2.54 95% Cl for difference: (-6.37, 1.28) T-Test of difference = 0 (vs not =): T-Value = -1.33 P-Value = 0.188 DF = 55 Two-Sample T-Test and Cl: GPA, Smoke Two-sample T for GPA StDev SE Mean 0.399 0.379 Smoke N ean No 302 3.173 0.023 Yes 43 3.054 0.058 Difference = mu (No) - mu (Yes) Estimate for difference: 0.1188 95% Cl for difference: (-0.0059, 0.2435) T-Test of difference = 0 (vs not =): T-Value = 1.91 P-Value = 0.061 DF = 56
Step by Step Solution
3.45 Rating (184 Votes )
There are 3 Steps involved in it
Pvalue 001 reject null hypothesis at 1 level of significance Here calculated Pvalue 0061 001 then accept null hypothesis that means there is no significance difference in mean GAP between smokers and ... View full answer

Get step-by-step solutions from verified subject matter experts